with articles on technical aspects of photography.
|
MTF as a Measure of Lens Resolution A brief introduction |

|
Back to the Nitty-Gritty section, with articles on technical aspects of photography. |
|
The MTF shows what percentage of subject brightness variability is shown in the resulting image. This is measured on a periodic, striped pattern changing along radial lines going away from the lens axis (sagital) or along concentric circles around that axis (tangential, or meridional).
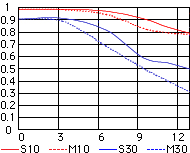
The higher the pattern frequency (more line pairs per unit length), the lower the MTF value: the "fuzziness" of contours fills the gaps between pattern lines. For a given (and high enough) frequency, higher MTF means higher lens resolution ("sharper" image). That response also varies with the subject distance from the lens axis: the resolution usually drops away from the image center; this is seen in the graphs below. For a given lens (and, in case of zooms, focal length), the MTF response depends on the aperture used. The off-axis light rays are more difficult to correct, so the MTF response (and image resolution) increases while the lens is being closed down. On the other hand, when the F-number goes above a certain value (i.e., the aperture becomes small enough), the MTF drops again. This is referred to as diffraction effect (roughly: bending of light rays passing through areas near aperture edges). The most common way used by lens makers to present the MTF for a given lens is to show graphs of MTF versus image height (more exactly: distance from the lens axis, measured in the image plane), at a given aperture value. An example MTF graph done this way is shown below.
| This graph (original link by Nikon broken) for the 18-55 mm, F/3.5-5.6 ED zoom lens at 55 mm, shows the MTF versus radial distance for two pattern frequencies: 10 and 30 cycles/mm, both sagital (S) and tangential (M). The aperture is not specified, therefore I'm assuming the maximum opening, F/5.6. The MTF at lower frequency (here: 10/mm) is often interpreted as the measure of the lens' contrast, while that at higher frequency (here: 30/mm) — of the resolution; my disagreement on the latter will follow below.
| 
| |
|
A common problem with MTF plots as the one shown above is that various manufacturers may present lines for various frequencies, and this makes any comparisons difficult or even impossible. The situation is additionally complicated in digital photography, when different lenses may be designed to work with cameras of different frame (sensor) format. We have to keep in mind that smaller frames have to be magnified more for viewing (the same print or screen size). Comparing two such lenses at the same frequency is not meaningful; the chosen frequencies should be inversely proportional to the frame size. For example, let us consider three lenses, one (A) designed for a 35-mm film camera, another (B) for APS-C, and the third one (C) for the Four Thirds format. The APS-C frame is about 1.6 times smaller than the 35-mm one, and for a Four Thirds camera the factor is 2×; as a result, the final image will have to be magnified more for cameras B and C than for A. To make MTF results comparable between all three cameras, the frequency used should be multiplied by the factors shown. Therefore, if lens A has MTF measured at 30/mm, we should compare it against a graph for lens B done at 45/mm, and for C — at 60/mm. Strangely, many lens makers pretend not to understand this and offer their MTF data at the same frequencies which were used for 35-mm film cameras (the numbers look better this way). Unfortunately, some makers (for example, Sigma) do not do that. therefore showing data which is not comparable against any other. Confusing? Yes, but the manufacturers like that. An additional problem arises from the fact, that sometimes the frequency is expressed not in terms of cycles (or line pairs: black plus white count as one), but as lines per millimeter (black plus white count as two). The latter value is twice as high as the former, so the MTF values will also be very different. This has to be kept in mind when comparing data from different sources. For example, Olympus publishes their MTF graphs for 60 lines/mm (or line widths, LW/mm). This is equivalent to frequencies of 30/mm (or line pairs, LP/mm), and, taking into account the factor of 2× in image size, these MTF values should be compared with those for a 35-mm camera, generated at 30 LW/mm or 15 LP/mm. |
|
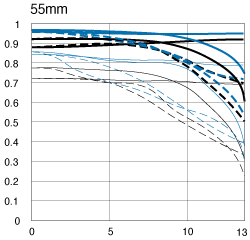
An extreme case is when a manufacturer does not bother at all to specify the frequencies in MTF graphs. ("Here is something which looks scientifically enough, this means our lens must be pretty good"). Such a presentation is useless for any purposes. For example, here is a graph for the Canon Digital Rebel "kit" 18-55 mm zoom at 55 mm. As you can see at the original page, from which this graph is being quoted, there are no line descriptions whatsoever; therefore the graphs convey no information. A crayon drawing by a preschooler would be equally informative. (If you see explanations, this means that Canon added them since I've last checked, January 18, 2007.) |

|
|
Another possible problem is, according to voices in discussion groups, that some manufacturers (most notably, Nikon) show curves which do not reflect actual measurements, but are computed based on the lens design. The measured MTF values will usually be lower, therefore comparing between both kinds is not really meaningful. While MTF analysis is a well-defined procedure, easy to standardize between different laboratories, as a physicist and photographer I do not consider graphs as those shown above the best measure of lens performance. In the past I came across a number of lenses with quite low contrast and still quite high resolution. These graphs are also not easy to interpret: is the lens of the center MTF of 0.7 much sharper than one with MTF of 0.64? A better way, still preserving the reproducibility of MTF, is to use a single, threshold MTF value corresponding to "yet visible" detail, and to show the frequency at which the MTF drops below that value. This technique is used by many independent researchers. This is easy to interpret: if lens A shows the central MTF of 0.5 at 40/mm, and lens B drops down to that value at 80/mm, the latter is capable of reproducing twice the detail. On the other hand, at the relatively low frequency of 20/mm both lenses may show the same MTF of, say, 0.6, which would indicate that both are equally "sharp". They are not! They are just equally contrasty at that frequency! It is even better to normalize the results by showing them not in terms of line pairs (LP) per millimeter, but per frame size (usually height, or IH). This approach takes away the effect of frame size: the number of lines at critical frequency can be referred to as "lens resolution" (measured in line pairs per image height), and data from various sources are directly comparable — as long as all those sources use the same critical frequency and measuring technique. Thus, if Lens A has — at a given aperture — a 50% center MTF al 1500 LP/IH (Image Height), and Lens B — at 1650 LP/IH (each possibly mounted on a different camera), it is relatively safe to say that Lens B has 10% more resolution at this aperture in the center. Such resolution figures, while they are still based on MTF measurements, seem to describe better the lens performance than the "raw" MTF data. Sometimes they are just quoted as a pair of numbers (central and peripheral, both averaged between sagital and tangential directions) for a given aperture, but you could also draw the 50% MTF frequency as a function of aperture for a number of fixed radial distances, or as a function of radial distance for a number of apertures. Either of these presentations is more informative than the "raw" MTF at a fixed frequency. Too bad that camera makers do not use this way of presentation. The makers of the popular camera-testing software, Imatest, also provide the results as MTF-50 frequencies per image height, except that their system measures the resolution of the whole imaging process: lens, the antialiasing filter (which makes the image a bit fuzzy to avoid aliasing), and digital processing (including demozaicing, interpolation, and sharpening). For best lenses this process (while being easier, faster, and requiring just a resolution chart, no specialized equipment) says more about the camera than about the lens itself, with the pixel resolution being one of the limiting factors. We have to keep this in mind, as quite a few reviewers are using the Imatest procedure. An ideal lens, when used on a camera with ten megapixels, and under assumption that no other process affects the effective, combined resolution, will measure as having the MTF-50 1.41× higher that the same lens mounted on a five-megapixel camera: this is the difference between the number of pixel rows. Here, again, the controversy between line pairs and line widths raises its little ugly head. Some testing procedures (including the Imatest software) quite the MTF-50 frequency not in line pairs, but line widths per image height: LW/IH; some others — in line pairs: LP/mm. And, again, this has to be remembered when comparing results from different sources. One or the Web sites showing test results generated with Imatest is the PhotoZone from Germany; generally a good source of information on photo equipment. | |
|
Here is an MTF-50 presentation similar to that generated by Imatest. Yellow bars show resolution values at center; brown ones — in corners. |

LW/IH at MTF=50% for the Duper 60 mm, F/2 Macro |
|
This particular lens/camera combination behaves nicely, sharp even fully open, and not losing resolution in corners. The drop at F/22 is due to diffraction effects, built into the laws of optics, so it cannot be helped. The picture indicates that the overall resolution is, in fact, limited by the pixel count and image processing: this is hinted by only a very slight increase of the figures between F/2 and F/4 or F/8. More reading This was just a brief introduction to the subject. If you want to pursue it further, these are worth reading:
| |

|
Back to the Nitty-Gritty section, with articles on technical aspects of photography. |
| Home: wrotniak.net | Search this site | Change font size |
| Posted 2006/07/30; last updated 2007/07/24 | Copyright © 2006-2007 by J. Andrzej Wrotniak |